The objective of this class assignment was for students to create an objective infographic around a topic of their choice. To be clear, this illustration had to depict something that was indisputably true. It could not be a personal belief or an opinion. Instead, we could cover topics like the statistics of birth rates, sports analytics, literacy rates.
Infographic Production
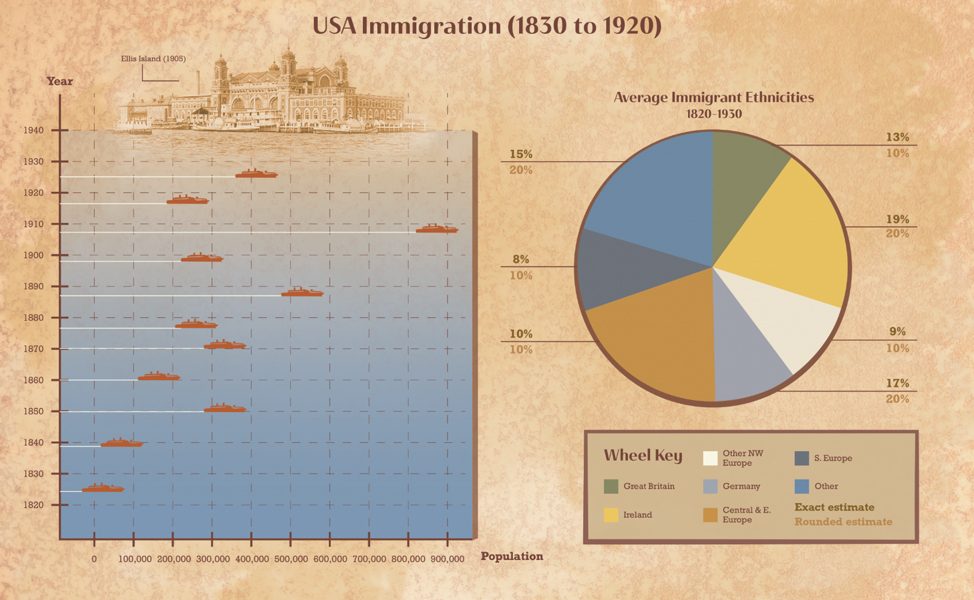
For my infographic, I wanted to cover the statistics around immigration during the Industrial Revolution. I preferably wanted to touch on race demographics over a span of several years in this era.
After looking for data, I chose to use the information in Table 1 (p28) of the 2007 research paper “Immigration, Industrial Revolution and Urban Growth in the United States, 1820-1920”
The following contains my initial sketches for my infographic
Once I discussed my ideas with my professor and classmates, I explored my final layout and composition until I settled on the following sketch.

Finally, I used a combination of Photoshop and Adobe Illustrator to create my final composition.